Oh data, I'm starting to love & understand you😘
Hi friends,
This was a long week, and I apologize for sending this edition out three days late. I promise there’s a reason for it. Last week I wrote about how I learned a LOT in VERY LITTLE time. And that streak continued this week. I spent time cleaning the biggest dataset I’ve dealt with so far — one with 🥁*27 MILLION ROWS!*🥁 It was data from 311, which, as I like to describe it, is New York City’s database of people’s complaints. Here’s the scary part with working with such a gigantic dataset as a newbie: It’s well … scary. It’s intimidating. Your code can break. Things can go horribly wrong. But, here’s the good stuff! I gained an appreciation and got to see firsthand just how much I can do with data. Which, brings me to illustrate something I’d been sitting on for a long time now: Why am I studying data journalism? What is data journalism?
Data driven journalism will help me make sense out of clutter, find trends and patterns in people’s behaviors. For instance, with the 311 service requests’ data, I can corroborate anecdotes.
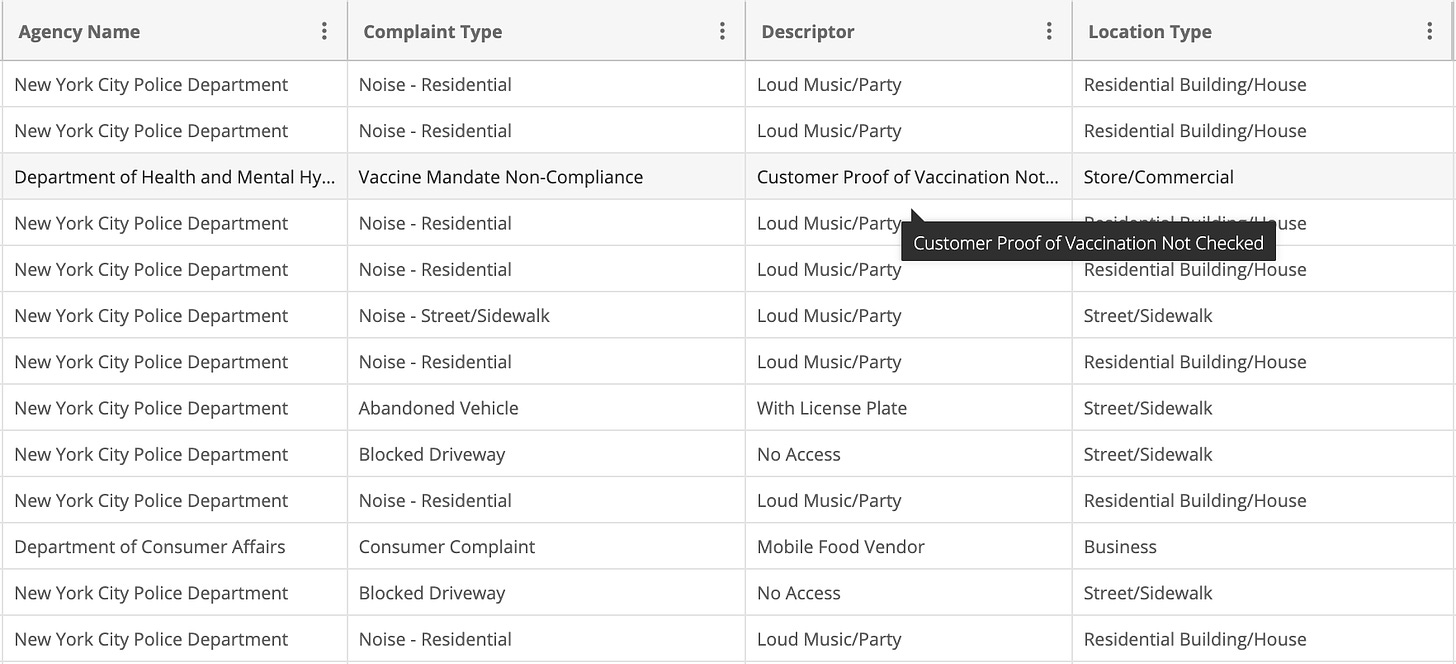
Below is a screengrab from the 311 data. I’ve highlighted a complaint about vaccine mandate non-compliance. The ability to clean up and analyze this dataset can help me figure out if vaccine mandate non-compliance (for example) is a common issue in the city. If it is, which parts are the most affected. Is there anything common in the violators and complainers?
Data-led journalim isn't new — reporters have long relied on structured analyses of government documents to find stories. From memos to building permits, government records are goldmines of data. With the right tools, I can now analyze unstructured datasets, create my own datasets, scrape information off of websites and more!
So here I am, pulling my hair over code that breaks and (mostly) patiently learning a lot of new things — all in the hopes of mastering data analytics.
Dear data, I’m (sort of) starting to understand you.
This week’s computer things
The art of Googling! + A fun resource!
What do I mean by the art of Googling? This week, with the many, many challeneges I faced with my homework, the one thing helped me the most was — Googling my way out!
What do I mean by that? One of my questions was to convert an object1 data type into datetime, which involves a complicated command. But, here’s how I mastered it! For one; I googled “DateTime Pandas” and got to its documentation (aka the official set of rules).
In the documentation, the most complicated bit to me was figuring out the format for the datetime for which too I (waitforit) GOOGLED! And, found an interactive to help me find my answer!
To read …
This is not so much a to read, as it is a cool resource I stumbled upon this week. I spent quite some time admiring this website and hope you like it too: Information is Beautiful
That’s all! Hope this new week is off to fantastic start! ✨
A word. Just that, really! A data type that you cannot operate mathematical functions on, aka, a … word! These are written in quotation marks – single or double, doesn’t matter!


